Wednesday, February 28, 2018

Keep This On Your Radar


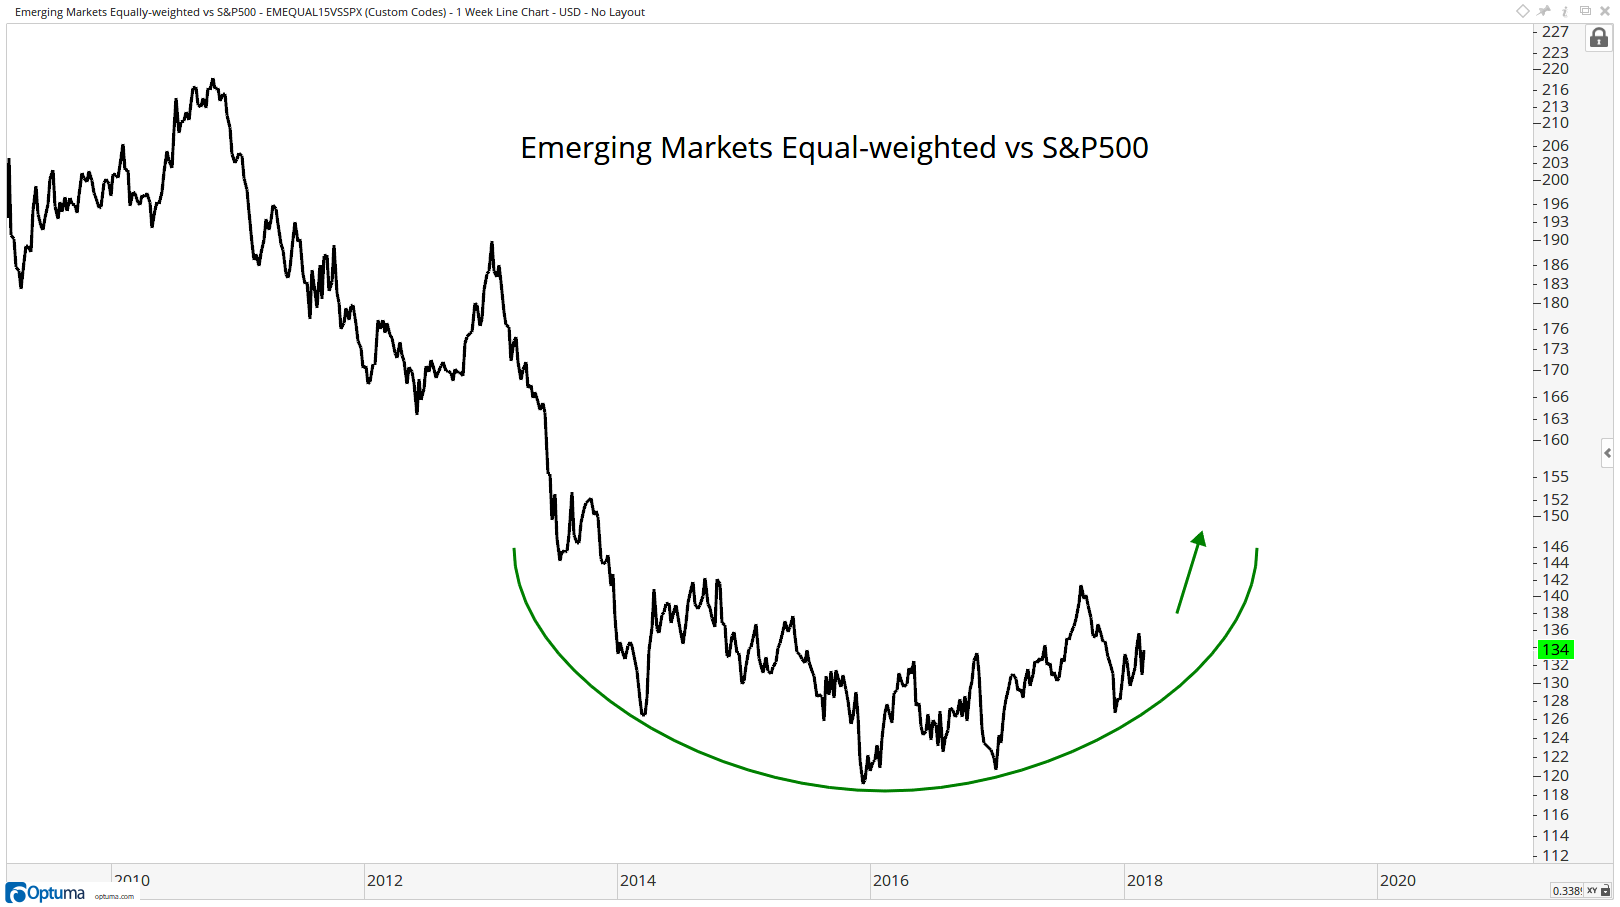
Markets have been choppy of late and that has also hit foreign markets.  This has also applied to emerging markets which also saw double-digit declines early this month.  However as noted at both  the blogs "Abnormal Returns" and "All Star Charts",  emerging market have seen their relative underperformance versus the S&P 500 end in early 2016Emerging markets and foreign investing badly trailed the US in the last decade so it wouldn't be a surprise to see interest in these areas of the world pick up, especially if this synchronized worldwide growth we've seen over the last year continues into 2018.  Perhaps it's time for foreign stocks to take on the mantle of market leaders?  Something to keep on your radar as the year unfolds.

Back later this week.

Long ETFs related to emerging markets and to the S&P 500 in client and personal accounts.  Short S&P 500 in a personal account as part of a separate individual strategy.
Monday, February 26, 2018

Chart Talk {Earnings Expectations}


Blackrock was recently out with an article "Eyeing Up Winners {and Losers} in the U.S. Tax Overhaul".   One of the things they chart in that article is the expectations for earnings growth in 2018.  Largely this is because of the recent changes to the tax code.  Here's part of their thoughts.

"The new tax law drops the statutory corporate rate 14 percentage points and offers companies easier and cheaper access to cash held overseas. The former is generally a bigger boon for domestically oriented companies, which have likely been paying an effective tax rate closer to the U.S. statutory level. The latter gives multinational companies greater reason to cheer, allowing for more flexibility in deploying cash. We note an uptick in mergers and acquisitions (M&A), for one, and companies generally have more cash to increase their business investment."

Whatever reason you want to pick from Blackrock's note the expected increase in earnings can be seen in the chart above.  2018's numbers are in gold.  The axis on the right shows the expected percent increase for estimated earnings.  What should be noted is how different the lines representing 2015-2017 look versus 2018.  Most years I've been in the business earnings estimates by analysts start out high and end lower.  The graph's depiction of 2015 and 2016 is pretty typical of what you can normally expect, although perhaps not at something close to a zero rate of growth like we saw in those years.  By-the-way that very low growth rate for earnings in 2015-2016 is largely why stocks for the most part trended water back then.  Stocks usually need earnings increases or expectations of increases to power higher.  

This increase in profits is largely what's been backstopping the markets recently, especially since those estimates continue to rise.  This could also have positive implications for earnings in 2019 as well.  

Back later this week.

Long ETFs related to the S&P 500 in client and personal accounts.  Short S&P 500 in a personal account as part of a separate individual strategy.

Thursday, February 22, 2018

Chart Talk {02.22.18}


Here's an updated chart of the S&P 500, again fromTradingview.com although the annotations are mine.  You can also double-click on the chart to make it larger if you would like.  As I've noted above it looks to me like most recently sellers have hit the market even on days where it has closed higher.  Major indices were up substantially more earlier today and were up yesterday before reversing in the afternoon on interest rate fears.  I think this is currently indicative of a market in a consolidation phase and also one that could potentially retest its earlier lows before trying to rally back to at least the old highs.  Of course there's no law that says this has to pan out exactly this way.  One clue on the near future will be to see if markets can break though that trendline we've shown on the chart above.

I will work on how you should be thinking about your portfolio next week.  Had a few glitches in the system that kept me occupied these past few days.

Back Monday.

Long ETFs related to the S&P 500 in client and personal accounts.  Short S&P 500 in a personal account as part of a separate individual strategy.

Tuesday, February 20, 2018

Examining Other 2018 Scenarios

Today we'll take a look at some other scenarios and try to give some idea on the chances of each happening.  Understand as we do this that we are only giving the likelihood of an outcome.  We are not saying any of these will occur.  Also there may be other ways the year could unfold that we're not thinking about, however, what we'll discuss below seem to be the most probable outcomes that could  happen.

Market Melt-up:  The market recovers from its step decline and mimics to some degree 2017's meteoric advance.  Stocks end 2018 with a better than 15% return, with the S&P 500 closing somewhere above 3,075.  I think we're going to need a few things to happen now for this to occur.  The first is that earnings are going to have to come in a lot better than indicated.  Right now that is occurring as the S&P 500 earnings estimates have moved north of $156.00 on a rolling four quarter basis.  Earnings in the high $150's could possibly move the needle for higher prices than investors might think right now, especially if those estimates are followed up with higher earnings numbers for 2019. I think the other thing that needs to happen for this to occur is for investors to shrug off the current inflationary and interest rate concerns.  Should earnings continue higher and investors ignore some of the negatives then there is a possibility of this happening.  Also I think this is the scenario least likely anticipated right now by investors.  

Estimated probability of occurring:  15-25%.  Perhaps the odds could be a bit higher if earnings continue to impress.

A More Serious Decline:  Markets spend most of 2018 in a trading range then some event or series of economic concerns comes to the forefront causing markets to head into a much deeper decline than most currently anticipate.  So in this scenario we are discussing a general market decline of greater than 25%.  Investors should understand that the historic volatility of stocks is currently between  12-15% so we are not talking about a normal market correction.  Here we are discussing the possibility of a major corrective event that could take stocks down by a percentage that would be classified as a bear market.  Absent an unexpected event I think this is a low probability outcome right now.  The economic news is simply too good and despite the hype in certain areas {cryptocurrencies or cannabis for example} there is no major asset bubble likely to strike across broad swaths of the economy like housing prior to the last decline.  It is possible in market's normal volatility that we could see a mediocre or even down year in stock values, but the probability of a secular bear market right now seems very low.  

Estimated probability of a market decline of greater than 25% occurring: 5-10%.

The Unexpected Event:  It is impossible to gauge such a probability because most of these could occur tomorrow or they could occur never.  I don't know how for example you assign a value to a significant natural disaster occurring or a terrorist event with mass casualties.  The probability is obviously not zero but is also not given that one will occur in the next 11 months.  Also some of the events that markets have focused on such as war in Korea have calmed down a bit recently.  If I had to include one unexpected event that could happen this year and is currently unlooked for in the markets it would be that in a massive rebuke to the Trump Administration, American voters go to the polls this fall in droves and throw the Republicans out of office in both the Senate and House.  An event like that could be market defining as it would throw into question the President's pro-business agenda for the remaining two years of his term. 

Estimated probability of an unexpected event:  2-5%
Estimated probability of Democrats taking control of both the House and Senate in 2019 15-25%.

Later this week we'll discuss what you need to be thinking about regarding your portfolio based on the current market environment and what we might see down the road.

Long ETFs related to the S&P 500 in client and personal accounts.  Short S&P 500 in a personal account as part of a separate individual strategy.

Friday, February 16, 2018

The Highest Probability Scenario For The Rest Of The Year


Trying to game plan for the rest of the year, given what we currently know, means examining a series of different scenarios and assigning a certain probability to each.  Today we'll take a look at the scenario that we believe has the highest probability of occurring this year.  We talked on Wednesday {the post immediately below this one} about a environment similar to 2015 through early 2016.  If that scenario should pan out then we think it would look something like what we're  showing in the chart above.  The chart is again from Tradingview.com although the annotations are mine.  You can double-click on the chart to make it larger if you would like.  What I want you to focus on under this scenario is the blue lines we've attached to the actual chart of the S&P 500 in the upper left hand corner.

Under this scenario we think you could see something like this.  Stocks spend much of the year consolidating their gains from the past two years.  The positives of underlying economic growth we are seeing and gains from the tax cuts runs into the worries of higher stock valuations, higher interest rates and higher inflation.  Also as the year ages we start adding political risk into the equation from the upcoming mid-term congressional elections.  In this scenario, stocks spend a better part of the spring finding a level of equilibrium from which they can again start to advance.  Markets then manage a stair step rally into early summer that potentially takes us back to the old highs set in January.  From there markets proceed to give most or all of that rally back, potentially retesting the spring lows.  Once we get into the fall and once the outcome of the elections are priced into stocks there is a possibility we again attack the old highs from January.  Under this scenario we see stocks showing price appreciation of 7-10% this year.  Now obviously it is unlikely the year will pan out exactly as I've drawn the lines.  They are a hypothetical general illustration.  Still it seems there is a very high probability that a scenario similar to what we've shown above is what we'll have seen once 2018 winds down.

Some of you might find this analysis a bit of a come down and such an environment would look poor compared to 2017.  However, keep in mind we had an explosive move at the beginning of the year.  We were up about 6% in most markets in January.  That sort of parabolic rise is simply unsustainable longer term.  Also individuals in modern times divide time periods mostly into years.  A better way to measure stock markets is in cycles.  If you look a bit further out and start with the last downdraft we had in stocks in early 2016 then you'll see we've been up more than 50% since then.  Markets viewed this way show a much more positive light.

Estimated probability of this scenario occurring 45-70% by our analysis.

Long ETFs related to the S&P 500 in client and personal accounts.  Short S&P 500 in a personal account as part of a separate individual strategy.

Wednesday, February 14, 2018

Chart Talk {Valentine's Day Edition}


Happy Valentine's Day.  Today we'll take another look  at a weekly chart of the S&P 500.  What we're trying to do is to build a template for what might be unfolding in the markets right now.  Again today the chart is from Tradingview.com and again the annotations are mine.  Also you can double-click on this chart to make it larger.  

I'm beginning to wonder if we are entering a period similar to what we saw from roughly 2015 to the latter months of 2016.   Going into that period the markets had seen a nice steady advance from lows it had developed in late September of 2011.  Over a better than 3-year period from that point the markets advanced nearly 90% before stalling out in the spring of 2015.   From that point on the markets hit a wall.  It took 14 months for stocks to again reach a new high.  During that period stocks also experienced two drops from high to low of greater than 10%.  The first came in the summer of 2015 and the 2nd in the winter of 2015-16.  

Stocks had become expensive back then.  The economy was growing but not at the clip we're seeing today.  Also you had the political issues of the "Brexit" vote and the looming American Presidential elections as a background.  In reality and in retrospect, stocks had simply become too expensive relative to their earnings growth rate and needed a reset.  Markets correct by three ways: price, time or a combination of both.  During that period we saw a combination of both price and time.  The key thing to take away from this is that while stocks went sideways for a considerable period of time, they ultimately found their footing and set the stage for the next move higher.  

One other thing which I hope the chart above shows.  The move we've seen in the last few weeks corresponds to abut a 12% move lower from the top to bottom.  Not that much different from what we saw back in 2015, although that move took a much longer period of time to play out.  I've shown both of those declines in the chart above for comparison.  The point of this is that from the levels we're at today it simply takes more points on whatever index you're looking at or whatever one the news media is focusing on to move the needle.  A 1% move in the S&P 500 is about 27 points right now.  A similar move in the Dow Jones Industrial average is about 250 points.  The papers can scream all they want about a 1,000 point drop in the Dow, but that's only about a 4% loss in terms of value.  Now that's a lot of points and a large percentage drop, but it is not unheard of to see this sort of thing occur and historically a loss in the 3-5% range happens about once every three years.  Usually these things occur at the end of a large run or when something unexpected arrives that catches investors unprepared.

Next we'll look at what we might expect going forward if what we're showing above is indeed a good template to use for the rest of the year.

Back Friday.

Long ETFs related to the S&P 500 in client and personal accounts.  Short S&P 500 in a personal account as part of a separate individual strategy.

Tuesday, February 13, 2018

Chart Talk {02.13.18}


Today we're showing a longer term weekly chart of the S&P 500.  This is the actual index and not the ETF.  The chart is from Tradingview.com although the annotations are mine.  We are like most investors trying to picture a roadmap for the coming months.  One of our preferred methods is what we call the Cone of Probability.  It is a probabilistic area based on a wide variety of inputs where we think markets have a potential to trade over a certain period of time.  You can read more about the Cone of Probability here.  Also you can double-click on this chart to make it larger.

One way we view this is to take earnings estimates and project out a probable range based on various Price to Earnings {PE} ratios.  To do this we've taken the current estimates for 2018 and 2019 and applied them to a chart of the S&P 500.  2018 has a current analyst earnings estimates around $154.00 and is pictured on the above chart in green.  Analysts are currently looking at about a 10% earnings increase for 2019.  If that would end up being correct then earnings would come in for 2019 about $170.00 and we've plotted this above in red.  Please note the trading lines we've shown on the chart don't exactly correspond to the numbers.  They are close but also take into account various levels of support and resistance that we can find on the charts.  Also the blue line you see running across the chart is the trendline dating back to the 2009 market lows.  It is here solely for reference.

First up we'll take a look at 2018 estimates.  Assuming we come in around $154.00 and assuming the economy continues to move along as planned then a PE range of 15 to 18 times earnings seems reasonable.  In that case we've plotted in green the various levels where stocks could trade.  A 15 PE in this year's earnings would equate to about a 12% drop for stocks from current levels.  An 18 PE would equal a gain from here of about 6%.  A 12-15% drop in stocks is well within the historical range in any given year we can see for the markets.  Remember last year was an extraordinarily low year for volatility.

If we look out to 2019 and again assuming the estimates hold at these levels or perhaps come in a bit better then a 15 PE on a $170.00 earnings estimate is about 3% lower from here and a 17 estimate on that number is about 7% higher from where we're currently trading.

Obviously these numbers are not set in stone.  Earnings could come in better or worse or stocks could trade at PE levels higher or lower than what we're showing above.  I think though it helps to have some sort of roadmap on what we could expect as the year progresses.  The analysis above gives you one of the methods we attempt to do that.

Long ETFs related to the S&P 500 in client and personal accounts.  Short S&P 500 in a personal account as part of a separate individual strategy.

Monday, February 12, 2018

Thoughts {02.12.18}

Well we've had an eventful two weeks in the markets haven't we?  I'm going to spend some time in the next few posts to try and give you some thoughts on where we might go from here.  Here's a brief:

Markets finally found a level where they were unwilling to climb further.  The combination of very over bought conditions, rising interest rates and rising inflation provided the concrete barrier that stocks slammed into starting at the end of January.  Once the bubble was popped investors ran for the hills.  The old Wall Street saying "stocks take an escalator higher and an elevator down" has been in play this month. 

So far today markets look to be stabilizing.  That is markets look to be trying to find a level of support from which to form some sort of rally.  The reaction to this rally that will be the most important thing to watch I think.  Stocks that make lower lows in the next few weeks could be showing a worrisome sign.  Same if stocks turn tail here and head lower.  On the other hand stocks that form a "V" bottom in here-that is a market that turns on a dime and powers to new highs could be signaling a stronger economy than most are currently expecting.

Wouldn't be surprised if stocks have made a high in January that holds until sometime in the fall.  Not a prediction, just stating a thought.

We may be seeing a sea change in how stocks are going to trade in the next few years.  

For all the bluster stocks are trading about a percent lower for 2018.  We're only in week seven.  Plenty of time for more positive results later on.

Back in the next few days.

Friday, February 09, 2018

Winter Letter: Disclosures


Christopher R. English is the President and founder of Lumen Capital Management, LLC.-a Registered Investment Advisor regulated by the State of Illinois. A copy of our ADV Part II is available upon request. We manage portfolios for investors and also manage a private investment partnership. The information contained here is taken from sources deemed reliable but cannot be guaranteed. Mr. English may, from time to time, write about stocks or other assets in which he or other family members has an investment. In such cases appropriate discloser is made. Lumen Capital Management, LLC provides investment advice or recommendations only for its clients. As such the information contained herein is designed solely for the clients or contacts of Lumen Capital Management, LLC and is not meant to be considered general investment advice.  Mr. English may be reached at Lumencapital@hotmail.com.

Winter Letter To Clients {Conclusion}

Today we conclude our most recent letter to clients.  Our next post will be sometime mid-week.

A Few Final Thoughts.

There are always worries in the markets and often it’s the event that nobody pays attention to that harms us the most.  That being said the current weight of the evidence seems to suggest that the underlying foundations for a positive market environment are still in place.  There is a higher probability that volatility will return in 2018.  However, it is the price investor’s pay for liquidity.  It is the market’s internal reset mechanism.  Investors should expect some volatility and should accept that sometimes prices will correct.   


Remember that whatever faults one may find with the current President, we currently have an Administration that is demonstrating a pro-growth business agenda.  If the Administration can continue executing on this plan then it has the potential to be good for our economy and ultimately good for the markets.  As such I think buyers will be found when volatility returns.  In that scenario investors will likely be rewarded for picking good solid ETFs that have appreciation potential as well as those that pay dividends and also using cash reserves to pick at bargains when the next correction finally occurs.


**Long ETFs related to the S&P 500 in client and personal accounts.  Short S&P 500 in a personal account as part of a separate individual strategy.

Thursday, February 08, 2018

Winter Letter To Clients {Part IV}

Here is part IV of our winter letter to clients.  We'll conclude this series tomorrow.


Will Markets Ever Sell-off Again?

The earlier discussion regarding 2018’s market range shows a wider potential price swing this year. This is partly because as markets advance the price range widens due to percentages.  It simply takes more points to move stocks even a percent at higher prices.  What this year’s range also takes into account is the possibility of a much wider market correction in 2018 than we’ve seen in some time.  Stocks haven’t seen a 10% correction since early in 2016.  You have to go back to 2011 by our calculations to find a more substantial decline in stock prices.  Since that last decline in early 2016, the S&P 500 has seen a price advance of 54%.  Yet historically prices decline in any given year somewhere between 10-15% for no reason other than what in retrospect is seen as normal price movement for stocks.  At some point this volatility will return and I worry that some investors are not mentally prepared for that possibility. 

Make no mistake, probability suggests we are in cyclical bull market every bit as powerful and as durable as the rally that lasted from 1982-2000. By that mark then we are about half way through this expansion.  However, even that bull market had periods where it paused to catch its breath and witnessed some pretty spectacular declines.  The most memorable drop was 1987 when prices dropped better than 30%, but there were also better than 10% declines in 1983, 1990, 1994, and 1998.  Most do not remember that the market went nearly four years before meaningfully recovering from the crash of 1987, the principal culprit then being the First Gulf War.  Each of those corrections should be seen in the context of that nearly two-decade bull market and none of these derailed its longer-term advance.  At some point we are likely to see a larger market decline, bouts of heightened volatility and a period longer than a few weeks where prices don’t advance.  Even in this rally, which started in March of 2009, there have been some long periods of time where stock prices in essence went nowhere.

Given how far we’ve come it’s reasonable to ask clients if anything has changed. The easiest way to start is with this exercise:  Open your end of year account statements, or your January statements assuming this rally holds into the end of the month.  Take that account value and lop off 10%.  Assume that is the minimum amount you could see your assets decline at some point in the next 12-18 months.  If your account is worth $200,000 assume it could be worth $180,000.  If it’s worth a million then assume at some point you see at a minimum $900,000.  Remember again, this is what is considered normal in even a bull market!  These may be hard numbers to look at for some if these could cause you to have trouble sleeping at night then we should talk.  I of course do not know when the next decline might occur.  Perhaps it has already started or we may still need to see much more of this advance before prices move lower, just know that it will come just like winter is a season, and then it will likely pass into spring.


**Long ETFs related to the S&P 500 in client and personal accounts.  Short S&P 500 in a personal account as part of a separate individual strategy.