Party Like It's 1999.
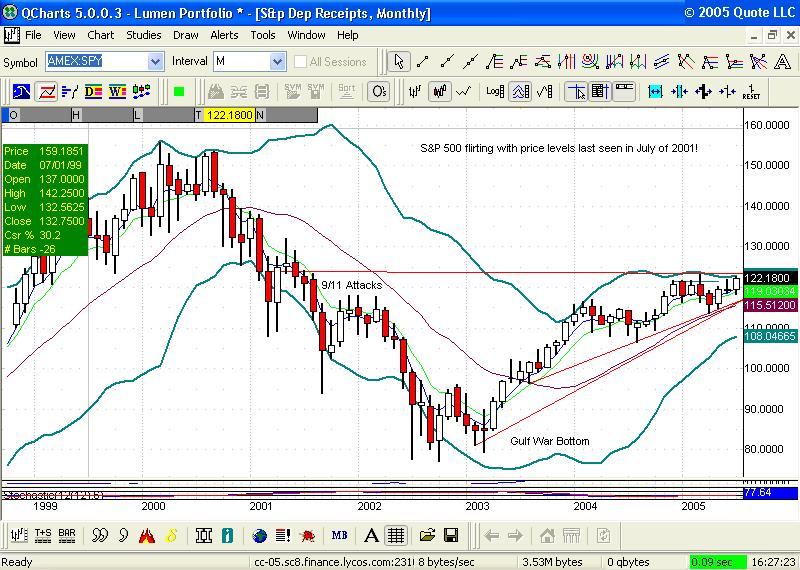
A monthly Chart of the S&P 500 ETF {Symbol SPY}. The Index has made it back to where it last traded in the Summer of 2001. {Red Line}. If you look further to the left you can see that the S&P has actually made it back to price levels it first passed in early 1999! The SPYs have traded within a range for about 18 months. An advance above these levels is likely to be viewed as long term positive by the markets.
*Mr. English and/or clients of Lumen Capital Management, LLC hold or have held positions in SPY. Although said positions are subject to change at any time.
NOTE:You can see a bigger picture of the included charts by placing your curser over the chart and double clicking on it. If you then wait a few seconds a little box should appear typically in the bottom right hand corner. Clicking on that box should give you a full screen version of the chart.
posted by CR English at 5:45 PM
![]()

0 Comments:
Post a Comment
<< Home