Something To Think About.
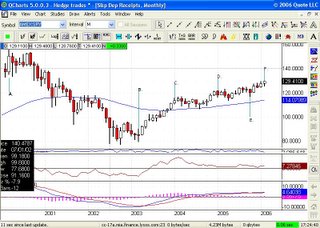
 Mutual Fund inflow data out of AMG* this week reported that investors added money into funds at a very high rate in the first part of this year. I thought that I would go back and look at some other instances when individual investors were either adding money to the market or taking it out. The illustration above is a monthly chart of the S&P 500 Depository Index {SPY}* going back through the year 2000. The letters on the chart correspond to each entry below. {Note: You can click on the chart to make it bigger.}
A. March 2000: 44 Billion dollars is invested in equity mutual funds. 100 Billion is invested in the 1st Quarter of 2000. Result. (Stock Market begins its historic decline with the S&P 500 losing almost 50% of its value.)
B. February-March 2003: 15 Billion dollars is removed from the equity markets in the buildup to the 2nd Gulf War. 10 Billion of this is removed in the 1st three weeks of March. (Stock Market rallys over 30% between March and the end of 2003.)
C. November-December 2003: 25 Billion dollars is invested in equity mutual funds. (Stock Market returns are flat until after the 2004 Presidential Election. Market experiences almost a 7% correction between January and August. August of 2004 sees equity outflows of almost 2 Billion. From August the stock market advances over 11%. )
D. November-December 2004: Over 20 Billion dollars is placed in equity mutual funds. (Stock Market declines almost 7% in the first 5 months of the year.)
E. Mid October 2005: Dollars invested in equity mutual funds are basically offset by dollars being taken out of funds. (Stock Market rallies almost 11% in the next four months.)
F. January-February 2006: Almost 30 Billion dollars is invested in equity mutual funds in the 1st two months of the year. (Result ?????)
*Certain clients of Lumen Capital Management, LLC were long SPY at the time of this post. Although positions can change at any time. Mutual fund data can be found @ http://www.amgdata.com/

<< Home